
Chain Efficiency vs. Rider Output
Goal:
To determine the efficiency of a multi-speed chain drivetrain vs rider output.
Chains:
Five models of re-lubed high-end 10sp chains were tested to determine efficiency at various load levels. A single sample of each of the following models was tested; Campagnolo Ultra Narrow 10 (Record), KMC X10SL, Shimano CN-7901 (Dura Ace), SRAM PC-1091R (Red), and Wipperman Connex 10S1. While the tested models are disclosed, the models are not individually identified on the graphs or data tables in this specific report.
Chain A, B, C, D, & E labels are used in lieu of models. This report is designed to evaluate the efficiency for a rear-derailleur drivetrain in general, and not to evaluate the performance of individual chain models. Best and worst performing chains were intentionally selected from the 25-chain sample pool for this test in order to analyze a large delta between high to low efficiency. Because of this selection method, the individual samples tested are not representative of an individual model’s average performance.
Results:
The energy consumption, aka frictional losses, of the drivetrain ranges from an average of 3.5 watts at 40W load to an average of 6.7 watts at 250W load (9.2 watts at 400W load, extrapolated). The friction losses increase linearly with load, with a 2.8 watt zero-offset. The graph below shows losses at given rider outputs for the 5 chains tested. Trend lines are extrapolated above 250W.
It is important to note the zero-offset, and why this occurs on rear-derailleur equipped bikes. The zero-offset is due to the frictional losses from the rear-derailleur and the lower three chain spans. These frictional losses are not dependent on rider output; they contribute a fixed amount of friction to the drivetrain, based on the RD style and the chain. The linear, and increasing, portion of the friction vs output line is due to the top chain span. The losses created by the top chain span are indeed dependent on rider output. The losses created by the top span increase linearly with increasing output.
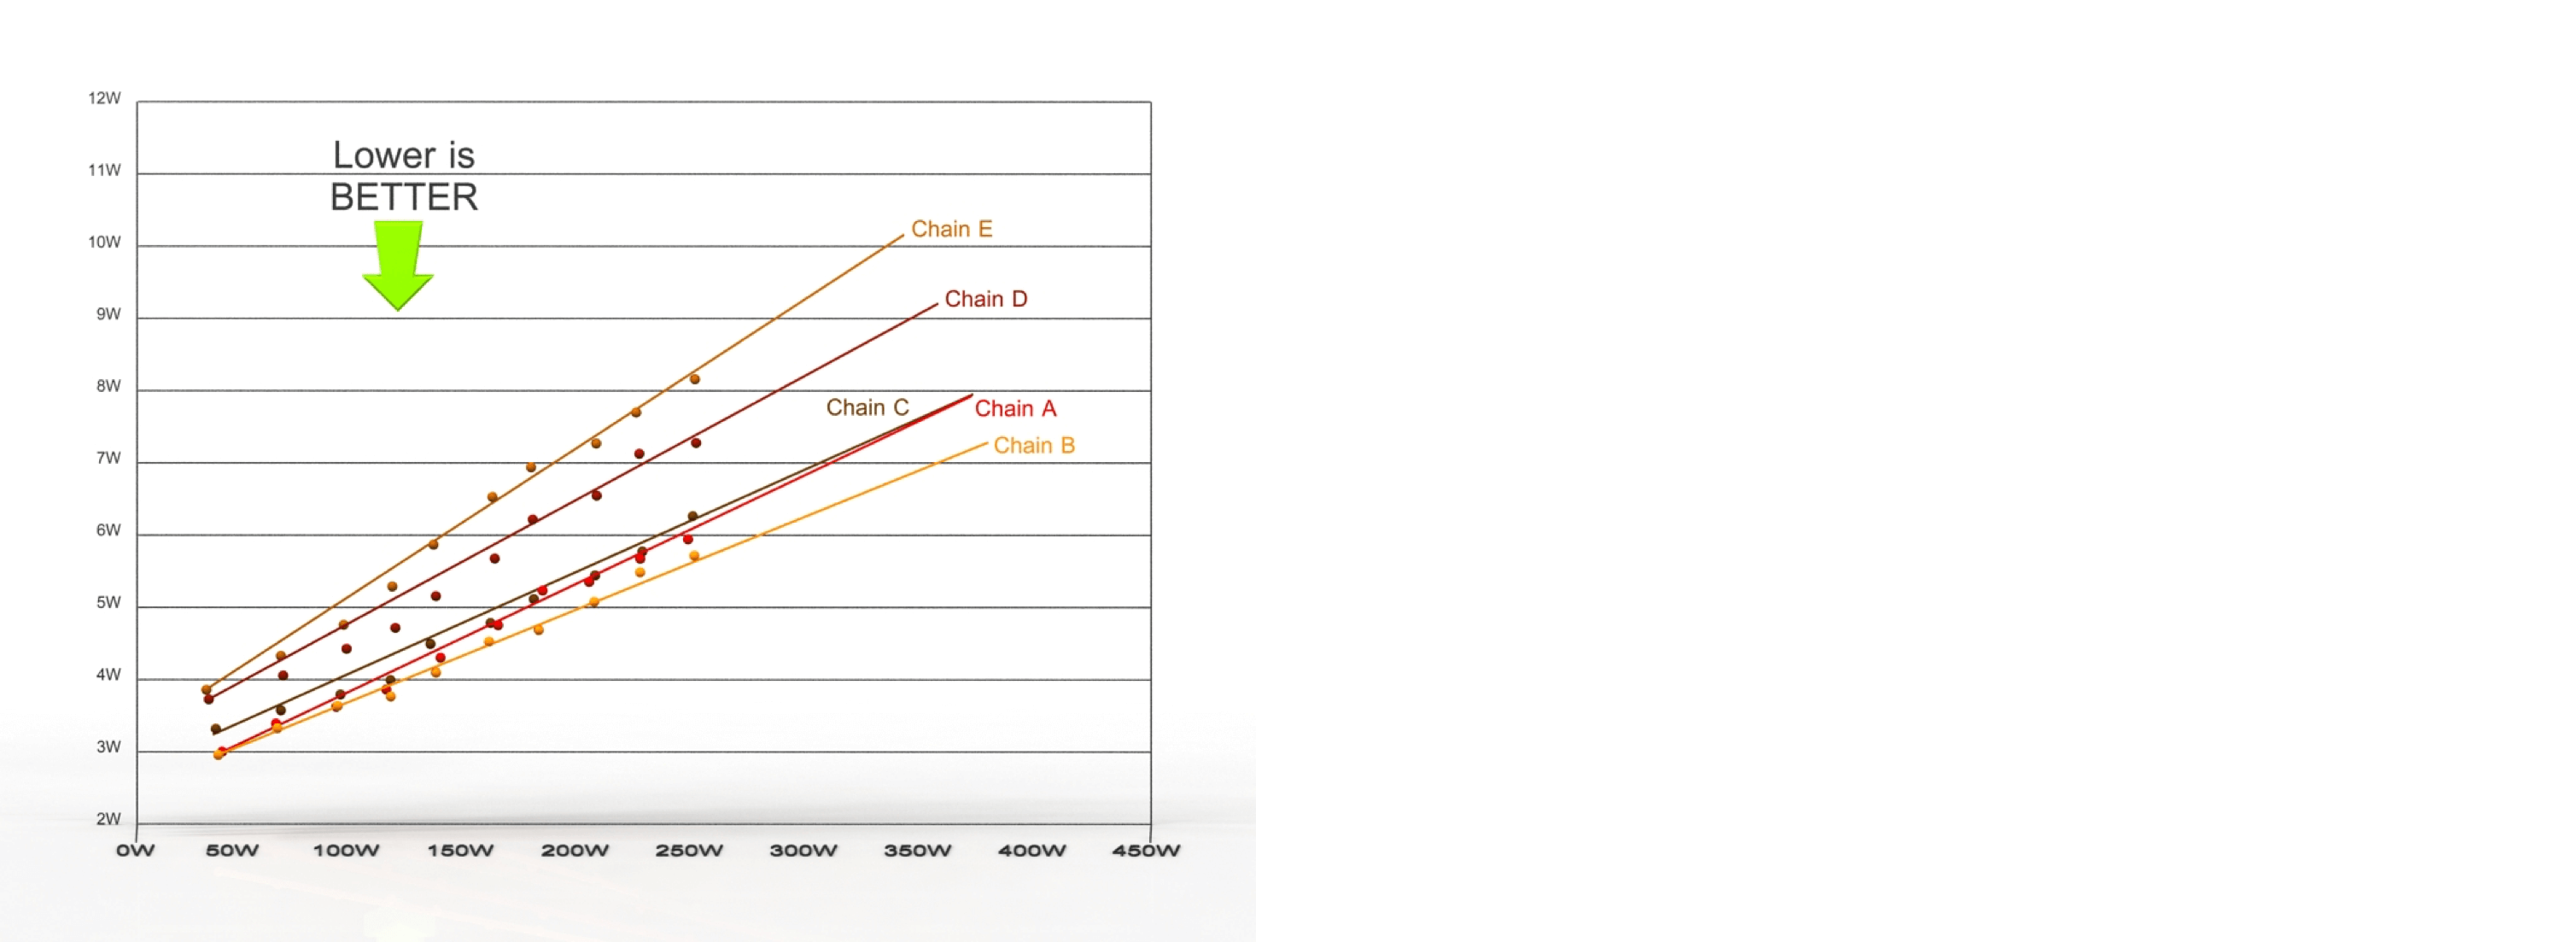
Graph 1. Chain frictional losses at given load.
When the losses are alternately plotted from a ‘drivetrain efficiency’ standpoint, efficiency increases in a non-linear trend with increasing load. The chain efficiency ranges from an average of 92.1% at 40W load to an average of 97.8% at 400W load. The graph below shows efficiencies at given loads for the 5 chains tested. Trend lines are extrapolated above 250W.
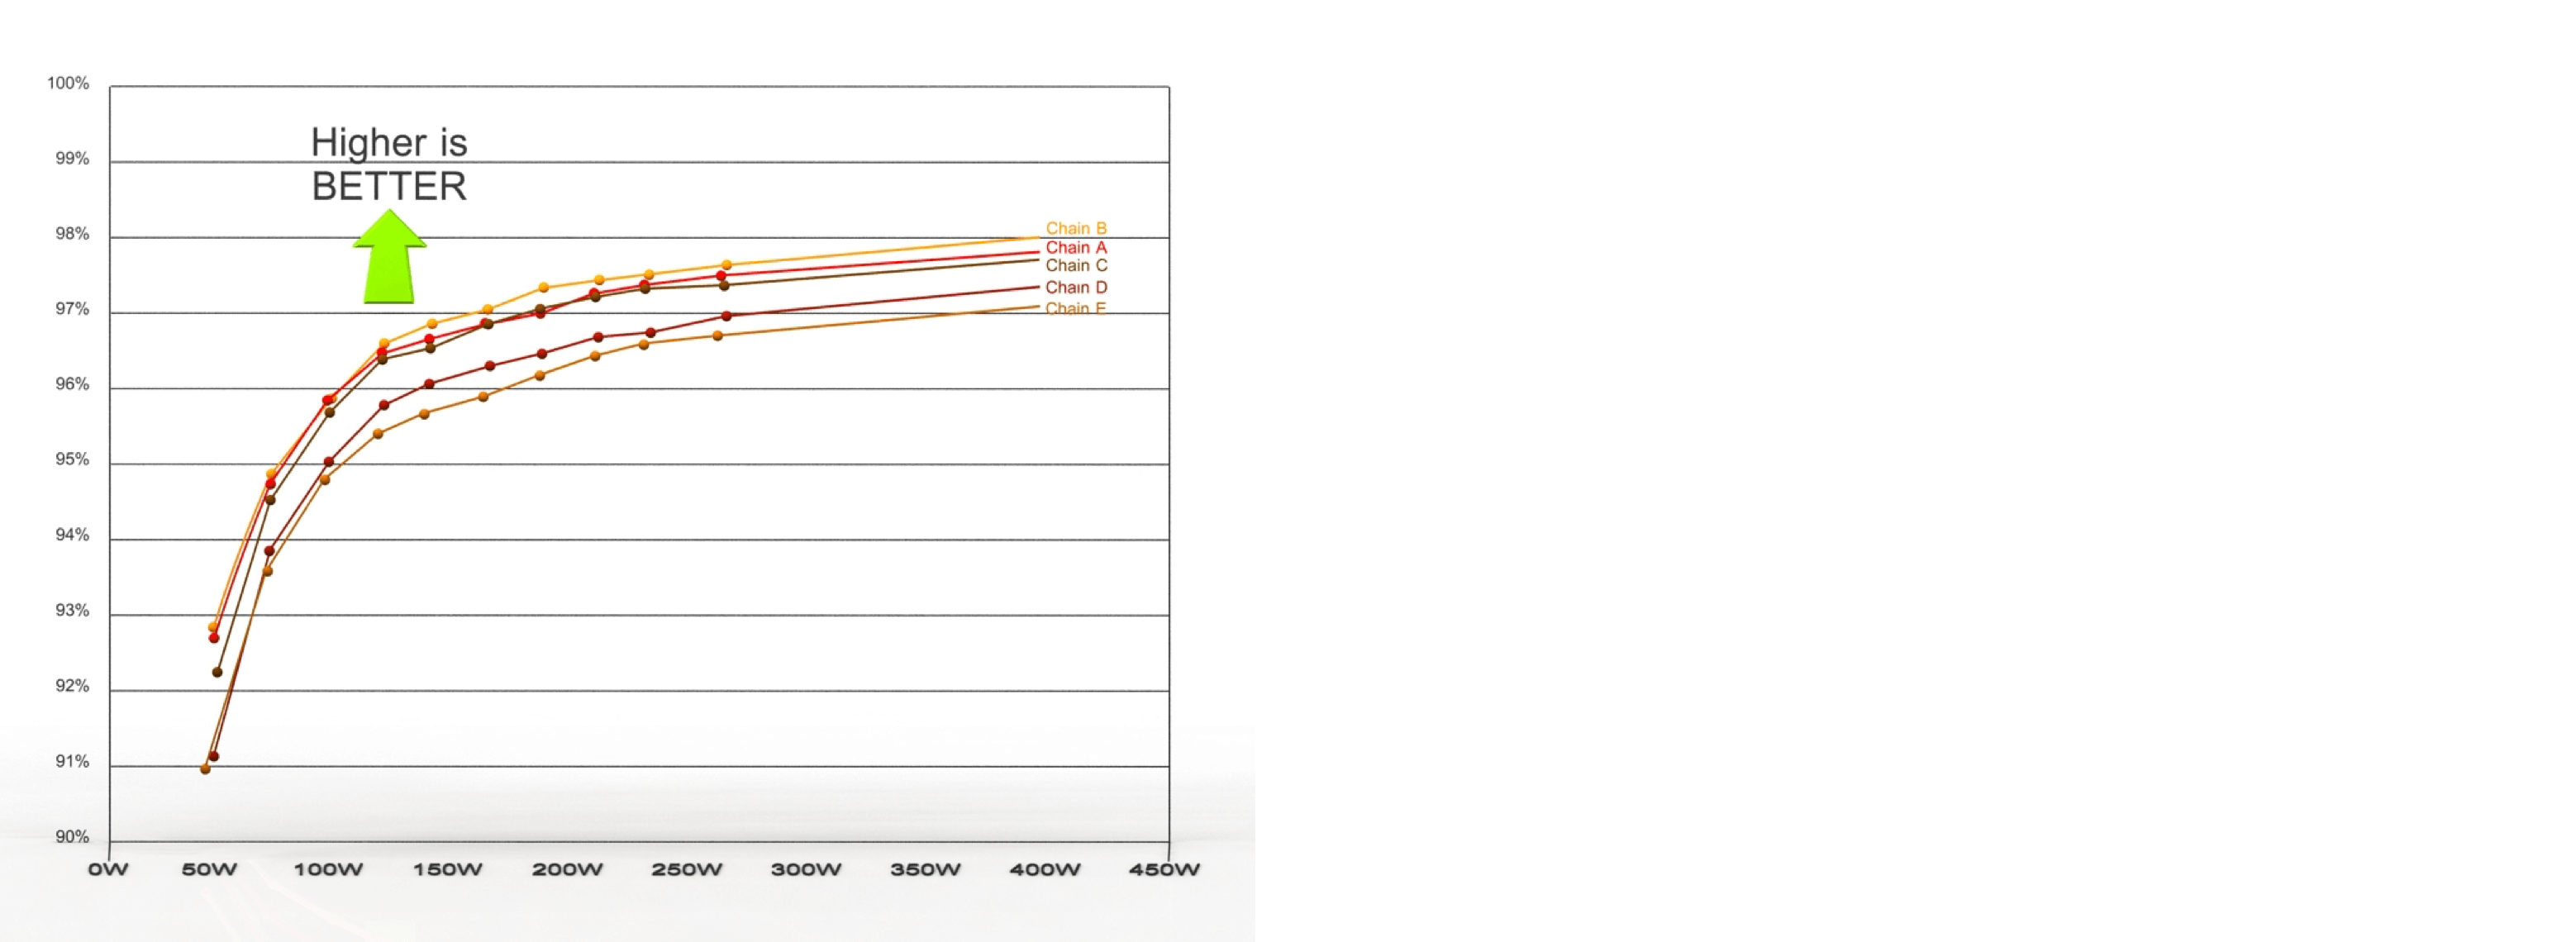
Graph 2. Drivetrain Efficiency (%) at given load
Test Details:
- Prior to testing, each chain was run on the test equipment in for 1hr (initial run-in), then cleaned and re-lubed with a light oil using an Ultrasonic machine to infuse the oil into the chain links.Re-lubing was done to remove any efficiency variations due to differences in factory lube between the models/manufacturers.
- A 53T-11T FSA ring/SRAM cog combination was used.
- 95rpm cadence.
- The Full Load Test Method was used.
- Each chain was tested at each load level for 10 minutes.The data point for a specific load level was captured at the end of the 10 minute interval.
- Data was averaged at 1-minute intervals.Sampling rate was 25 samples/second.
- Data points were taken up to and including 250W.The trend lines were extrapolated to 400W to provide an estimate of the probable efficiency above 250W.
- The accuracy of the FLT is +/- 0.25 watts.
- Equipment system losses (the losses from the ceramic bearings used in the test equipment) are inherently present.For the ‘Results’ graph above and table below in this report, the bearing system losses were removed from the ‘chain friction losses’ column.
- Chain Percent Efficiency column below is defined as [Work Out]/[Work In] x 100.The system losses were removed from Work In and Work Out prior to calculating.
Data Table:
| CHAIN A Crank Watts |
Load Watts | Chain Friction Losses (w) (system losses removed) |
% efficiency |
| 44.2 | 40.89 | 3.18 | 92.79 |
| 69.21 | 65.49 | 3.57 | 94.83 |
| 93.68 | 89.72 | 3.8 | 95.94 |
| 118 | 113.79 | 4.04 | 96.57 |
| 138.3 | 133.63 | 4.48 | 96.75 |
| 162.37 | 157.23 | 4.93 | 96.96 |
| 186.03 | 180.39 | 5.41 | 97.09 |
| 209.53 | 203.77 | 5.53 | 97.36 |
| 231.65 | 225.56 | 5.85 | 97.47 |
| 254.44 | 248.06 | 6.12 | 97.59 |
| extrapolated | 325 | 7.32 | 97.8 |
| extrapolated | 400 | 8.42 | 97.94 |
| CHAIN B Crank Watts |
Load Watts | Chain Friction Losses (w) | % efficiency |
| 44.66 | 41.36 | 3.17 | 92.89 |
| 69.88 | 66.19 | 3.54 | 94.92 |
| 94.61 | 90.6 | 3.85 | 95.92 |
| 119.12 | 114.97 | 3.98 | 96.65 |
| 139.51 | 135.02 | 4.31 | 96.91 |
| 163.8 | 158.86 | 4.74 | 97.1 |
| 187.57 | 182.47 | 4.9 | 97.39 |
| 211.1 | 205.59 | 5.29 | 97.49 |
| 233.56 | 227.62 | 5.7 | 97.56 |
| 256.68 | 250.5 | 5.93 | 97.69 |
| extrapolated | 325 | 6.87 | 97.93 |
| extrapolated | 400 | 7.86 | 98.07 |
| CHAIN C Crank Watts |
Load Watts | Chain Friction Losses (w) | % efficiency |
| 44.5 | 40.98 | 3.38 | 92.38 |
| 69.57 | 65.71 | 3.71 | 94.66 |
| 94.1 | 90.01 | 3.93 | 95.82 |
| 118.65 | 114.35 | 4.13 | 96.52 |
| 139.14 | 134.32 | 4.63 | 96.67 |
| 163.32 | 158.2 | 4.92 | 96.99 |
| 186.88 | 181.41 | 5.25 | 97.19 |
| 210.63 | 204.82 | 5.58 | 97.35 |
| 232.98 | 226.82 | 5.91 | 97.46 |
| 256.18 | 249.51 | 6.4 | 97.5 |
| extrapolated | 325 | 7.32 | 97.8 |
| extrapolated | 400 | 8.4 | 97.94 |
| CHAIN D Crank Watts |
Load Watts | Chain Friction Losses (w) | % efficiency |
| 44.54 | 40.56 | 3.82 | 91.39 |
| 69.66 | 65.34 | 4.15 | 94.03 |
| 94.5 | 89.79 | 4.52 | 95.21 |
| 119.13 | 114.12 | 4.81 | 95.96 |
| 139.71 | 134.24 | 5.25 | 96.24 |
| 164.09 | 158.08 | 5.77 | 96.48 |
| 188.2 | 181.63 | 6.31 | 96.64 |
| 211.81 | 204.89 | 6.64 | 96.86 |
| 234.55 | 227.03 | 7.22 | 96.92 |
| 257.86 | 250.18 | 7.37 | 97.14 |
| extrapolated | 325 | 8.8 | 97.36 |
| extrapolated | 400 | 10.16 | 97.52 |
| CHAIN E Crank Watts |
Load Watts | Chain Friction Losses (w) | % efficiency |
| 42.7 | 38.79 | 3.75 | 91.18 |
| 67.96 | 63.58 | 4.2 | 93.8 |
| 92.82 | 88.01 | 4.62 | 95.01 |
| 117.32 | 111.98 | 5.13 | 95.62 |
| 138.12 | 132.2 | 5.68 | 95.88 |
| 162.59 | 156.01 | 6.32 | 96.11 |
| 186.32 | 179.33 | 6.71 | 96.39 |
| 210.12 | 202.8 | 7.03 | 96.65 |
| 232.95 | 225.2 | 7.44 | 96.8 |
| 256.39 | 248.18 | 7.88 | 96.92 |
| extrapolated | 325 | 9.53 | 97.15 |
| extrapolated | 400 | 11.04 | 97.31 |